

★★★★★ 4.7/5 — The book that gave “correlation is not causation” its missing second half.
Best for: Data analysts, ML engineers, product and policy people, and anyone who wants sharper reasoning about cause and effect.
Reading time: ~7 hrs for the full book · about 12 min for this summary
Difficulty to apply: Moderate — the ideas are simple, the underlying math is not; this summary stays conceptual.
The Book of Why in one minute
Most “data-driven thinking” — and most machine learning — never gets past spotting patterns. Judea Pearl, a Turing Award-winning computer scientist, and science writer Dana Mackenzie argue real intelligence requires climbing higher: from seeing patterns, to testing interventions, to imagining counterfactuals. They call this the Ladder of Causation, and built a mathematical toolkit — causal diagrams and do-calculus — to climb it rigorously instead of by gut feeling.
For decades, mainstream statistics treated “causation” as almost forbidden — too easy to get wrong. Pearl argues this caution went too far: it left researchers unable to formally ask what happens if we intervene, or what would have happened had we acted differently. The Book of Why makes that case, and builds the toolkit to answer them rigorously.
Key takeaways
- The Ladder of Causation has three rungs: Association, Intervention, and Counterfactuals — each demands more than the one below it.
- Most machine learning lives on rung one. Pattern-matching models predict what usually follows what, but can’t say what would happen if you changed something.
- Correlation misleads in nameable ways — confounding, reverse causation, and coincidence can all fake a link that isn’t there.
- Simpson’s Paradox shows correlation can flip direction between subgroups and the combined population, purely from how a hidden variable is distributed.
- Causal diagrams (DAGs) make assumptions explicit — draw what you believe causes what, and the diagram tells you what to control for.
- Not every variable should be controlled for. Controlling for a “collider” can create a fake correlation that wasn’t there before.
- Do-calculus turns causal questions into solvable math — it tells you whether an intervention’s effect is computable without an experiment.
- Counterfactual reasoning separates understanding from prediction — regret, credit, and blame are all counterfactual, and Pearl says AI needs this for real common sense.
- You cannot get causation from data alone. Some causal assumption — a diagram, a known mechanism — always has to come from outside the dataset.
- This is a working toolkit — already used in epidemiology, economics, and AI research.
What is The Book of Why about?
The Book of Why (2018) argues that data alone can never answer “why” questions — only a causal model can. Judea Pearl and Dana Mackenzie present the Ladder of Causation (association, intervention, counterfactuals) and the tools — causal diagrams and do-calculus — that let scientists, policymakers, and eventually AI reason rigorously about cause and effect, not just correlation.
About the author
Judea Pearl is a computer scientist and statistician at UCLA, where his early work on Bayesian networks gave machines a formal way to reason under uncertainty — work for which he won the 2011 Turing Award, computing’s highest honor. In the 1990s and 2000s he turned to a harder problem: bringing that same rigor to cause and effect, developing causal diagrams and do-calculus as a mathematical language for “why” questions statistics had long avoided. Dana Mackenzie is a mathematician turned science writer and author of several books translating advanced mathematics and physics for general readers. Together they paired Pearl’s decades of research with Mackenzie’s gift for narrative to write The Book of Why (2018), turning a technical research program into an accessible argument about the limits of pattern-matching and the future of causal AI. Explore all Dana Mackenzie book summaries →
Key concepts at a glance
| Concept | What it means | Use it when |
|---|---|---|
| Ladder of Causation | Three levels of reasoning: seeing, doing, imagining | Diagnosing whether a claim is really causal or just a pattern |
| Association (Rung 1) | Spotting correlations and patterns in data | Exploratory analysis, prediction from existing conditions |
| Intervention (Rung 2) | Predicting the effect of actively changing something | Designing an experiment, a policy, or a product change |
| Counterfactual (Rung 3) | Reasoning about what would have happened otherwise | Assigning credit or blame, explaining a single past event |
| Confounding variable | A hidden factor that drives two things that look linked | Two trends move together with no obvious mechanism |
| Simpson’s Paradox | A trend reverses when subgroups are combined | Comparing results across unevenly sized or assigned groups |
| Causal diagram (DAG) | A picture of your assumptions about what causes what | Deciding what to control for — and what not to |
| Do-calculus | Rules for computing an intervention’s effect from data plus a diagram | Estimating a causal effect without running a real experiment |
| Collider | A variable caused by two others; controlling for it can distort results | Checking that a “control variable” isn’t secretly creating bias |
Part 1: The Ladder of Causation — Why Seeing Isn’t Understanding
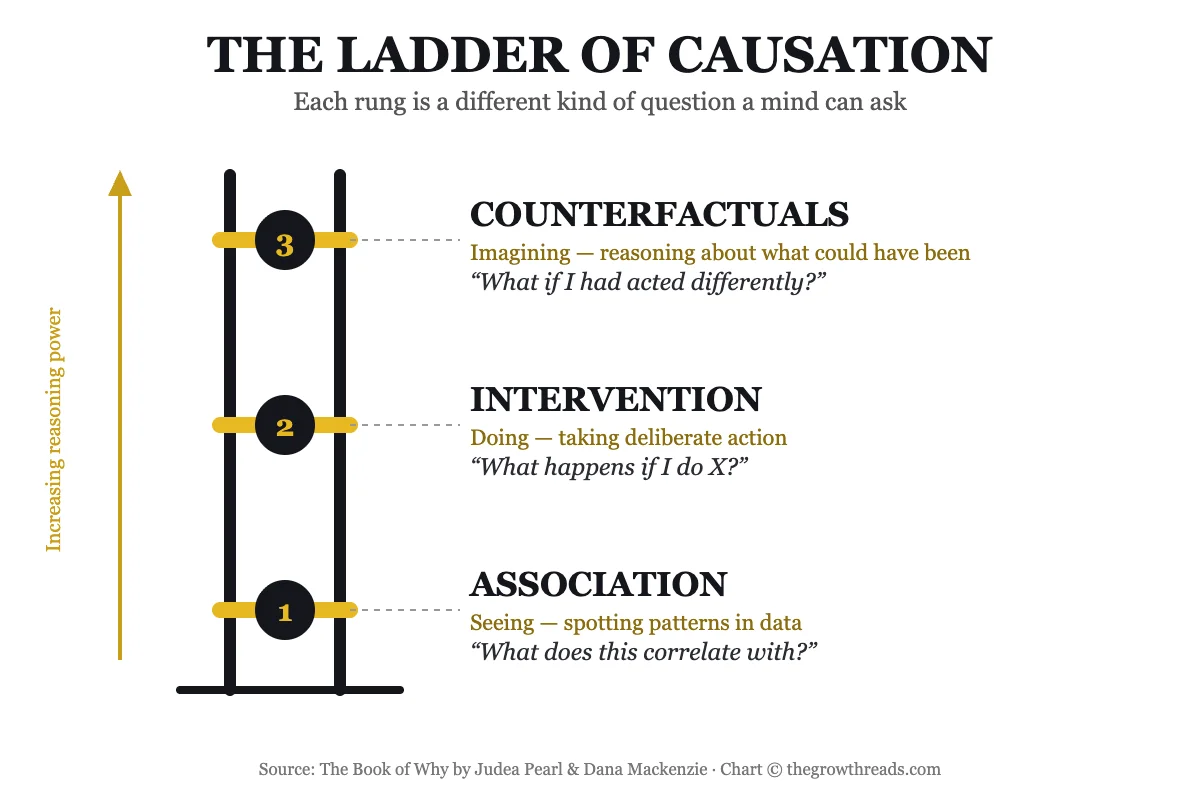
Pearl opens with a simple claim: there are three fundamentally different kinds of questions about the world, and most statistics — and most machine learning — only ever answers the easiest one.
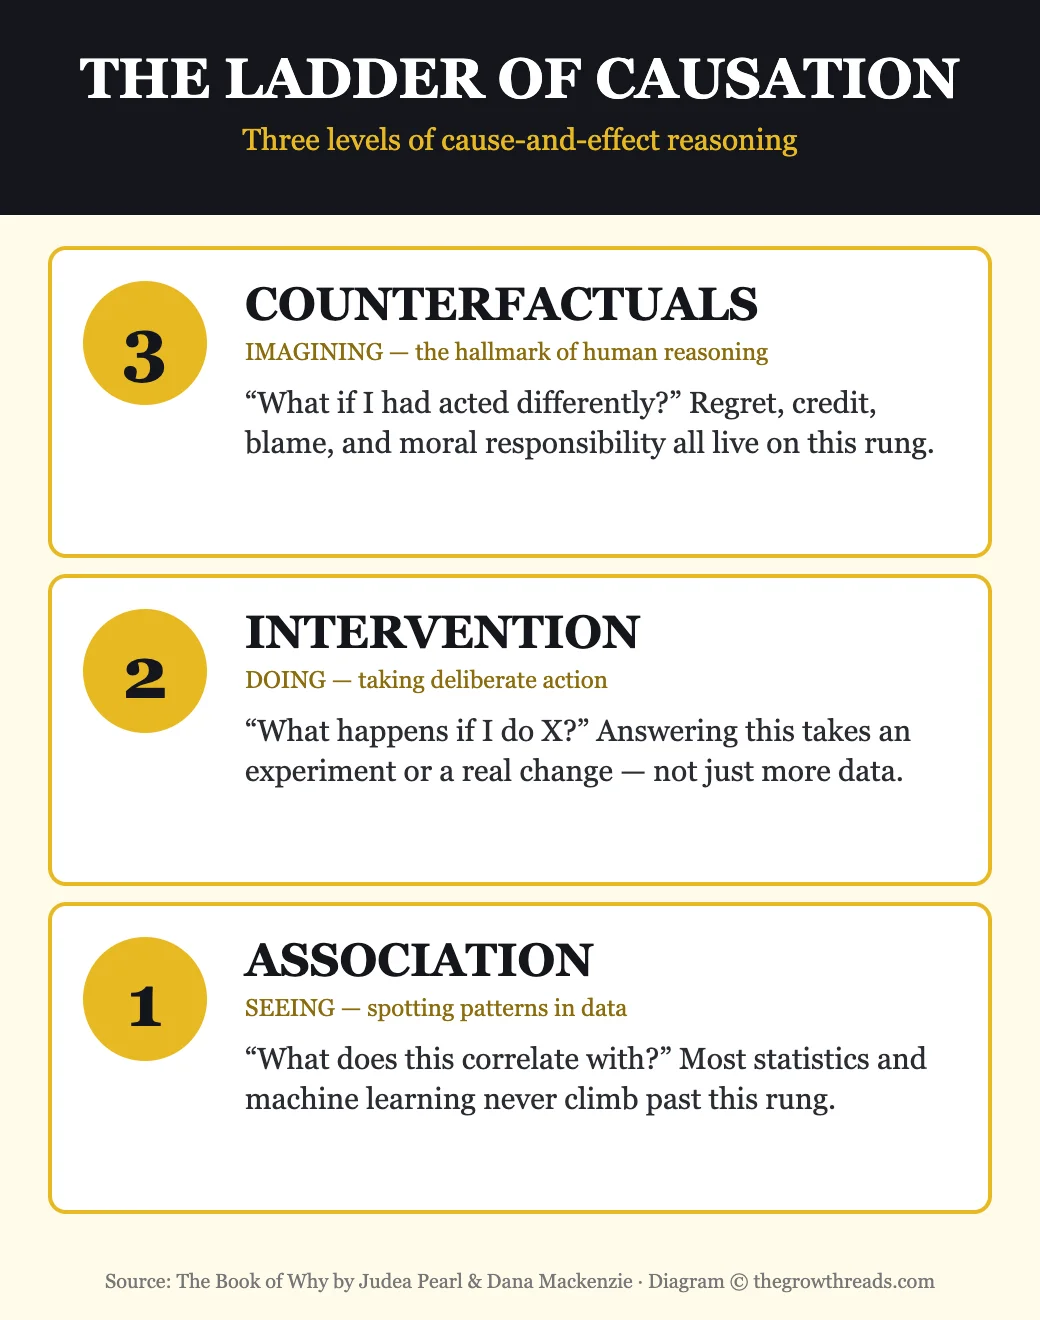
Rung 1, Association, is “seeing.” This is “what is correlated with what” — noticing smokers get lung cancer at higher rates, or a stock’s price moves with a competitor’s. Almost all classical statistics lives here, and so does most machine learning: a model predicting the next word is counting patterns it has already seen, and can be extraordinarily good at that while having no idea what would happen if the world changed.
Rung 2, Intervention, is “doing.” This is “what happens if I make X happen” — not observing aspirin-takers report fewer headaches, but actually giving someone aspirin and watching what changes. A randomized controlled trial is rung 2 made physical: intervening directly breaks the tangle of confounding factors that muddy rung-1 observation. Pearl’s contribution was showing that, under the right conditions, you can answer rung-2 questions from rung-1 data alone — without running the experiment — provided you’re honest about your causal assumptions.
Rung 3, Counterfactuals, is “imagining” — “what would have happened if I had acted differently,” the hallmark of regret, credit, blame, and moral responsibility. It’s not a general policy question but one specific case: would this patient have survived if she’d taken the drug? Pearl argues this is where human-like reasoning lives, and where today’s AI is weakest, because counterfactual questions require a model of the mechanism, not just its outputs.
Each rung is strictly more demanding than the one below it — you cannot derive a rung-2 answer from rung-1 data, or rung-3 from rung-1 or rung-2, without an added causal assumption. This is Pearl’s formal version of an old warning, “no causes in, no causes out.”
TGR Note: Pedro Domingos’s The Master Algorithm surveys machine learning’s major schools — and nearly every one, from decision trees to deep nets, is fundamentally a rung-1 pattern finder. Even the most sophisticated “master algorithm” imaginable is still climbing rung one until it can represent interventions and counterfactuals explicitly.
Part 2: The Trouble with Correlation — and Simpson’s Paradox
If rung 1 were harmless, none of this would matter — but association actively misleads, in specific, nameable ways.
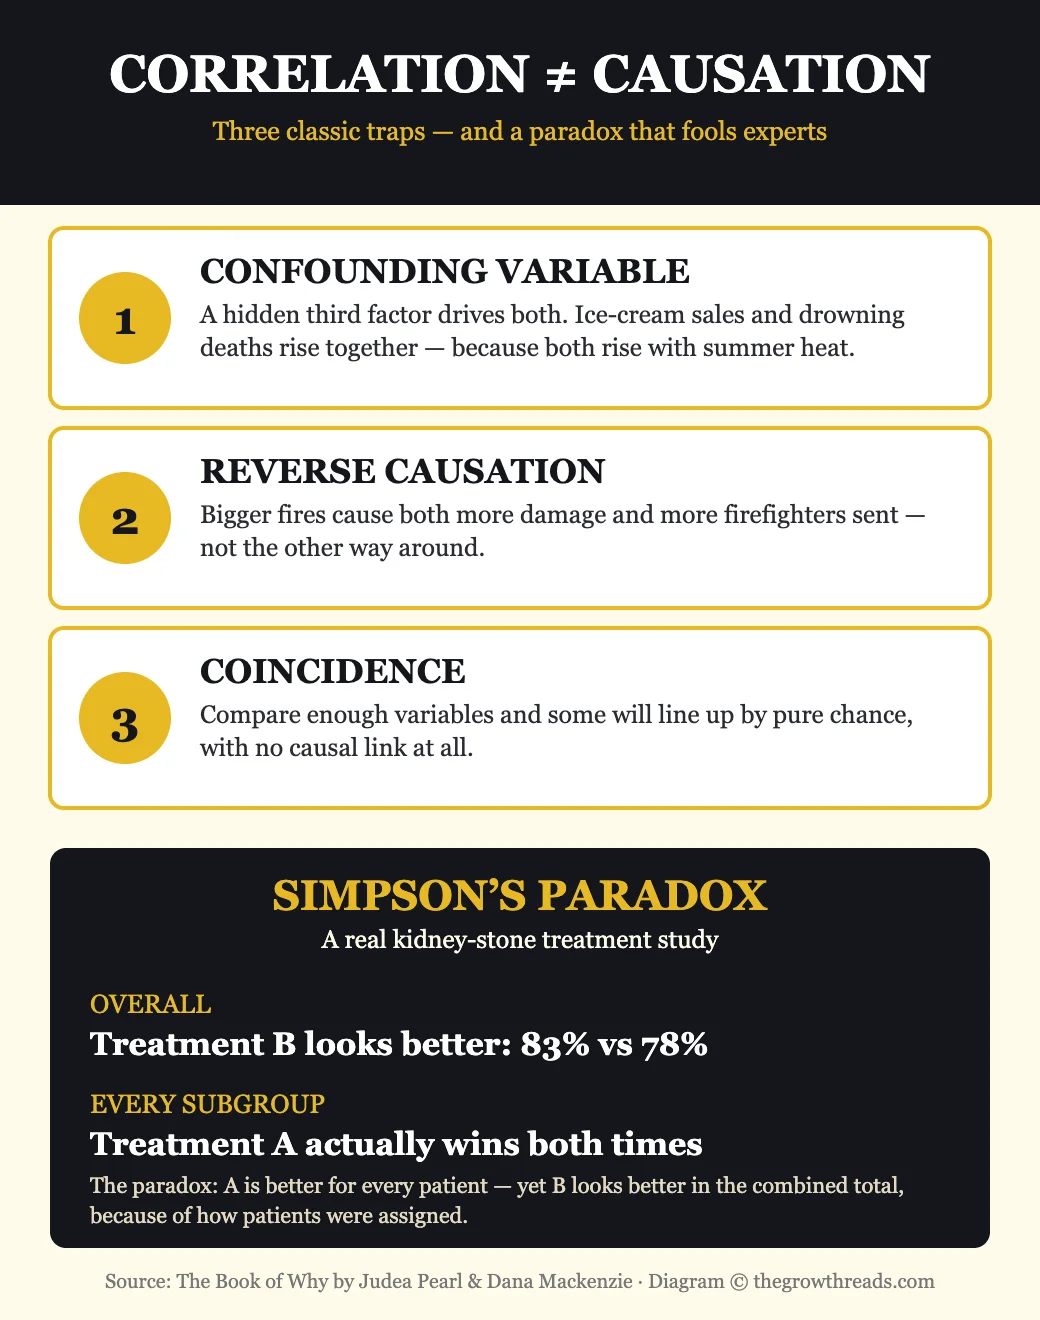
Confounding is the most common trap — a hidden third factor drives two things that look connected. Ice cream sales and drowning deaths rise and fall together — not because ice cream causes drowning, but because both climb with summer heat. The classic older example: storks nesting and local birth rates both tend to rise with a town’s size and rurality, with no stork involved in either.
Reverse causation flips the arrow: cities with more firefighters have more fire damage — until you notice bigger fires call more firefighters and cause more damage, not the reverse. Coincidence is the least interesting but most common trap today: compare enough variables and some will correlate by pure chance alone.
The most unsettling trap is Simpson’s Paradox, where a correlation doesn’t just mislead — it reverses. Pearl discusses a well-known real medical example: a study comparing two kidney-stone treatments found Treatment B had a higher overall success rate. But split by stone size, Treatment A won in both the small-stone and large-stone subgroups. The reversal happened because doctors were more likely to give harder-to-treat large stones the more aggressive Treatment A — so its overall numbers were dragged down by tackling tougher cases, not by being worse. Look at the combined total and you’d pick the wrong treatment; look at the subgroups and the answer flips.
This is why correlation-only analysis is dangerous: trusting the aggregate or the subgroups depends on the causal structure behind the data, not the raw numbers.
TGR Note: Cathy O’Neil’s Weapons of Math Destruction catalogs real algorithms that mistake correlation for a green light — scoring people by proxies that correlate with an outcome without asking whether the proxy is actually causal. Pearl’s traps here are the theoretical explanation for exactly the harm O’Neil documents in practice.
Part 3: Causal Diagrams — A Language for What You Believe
If correlation is untrustworthy alone, Pearl’s answer is to draw a picture. A causal diagram — a directed acyclic graph, or DAG — is circles (variables) connected by arrows (causal influence), forcing you to state explicitly what you believe causes what, instead of burying it inside a model.
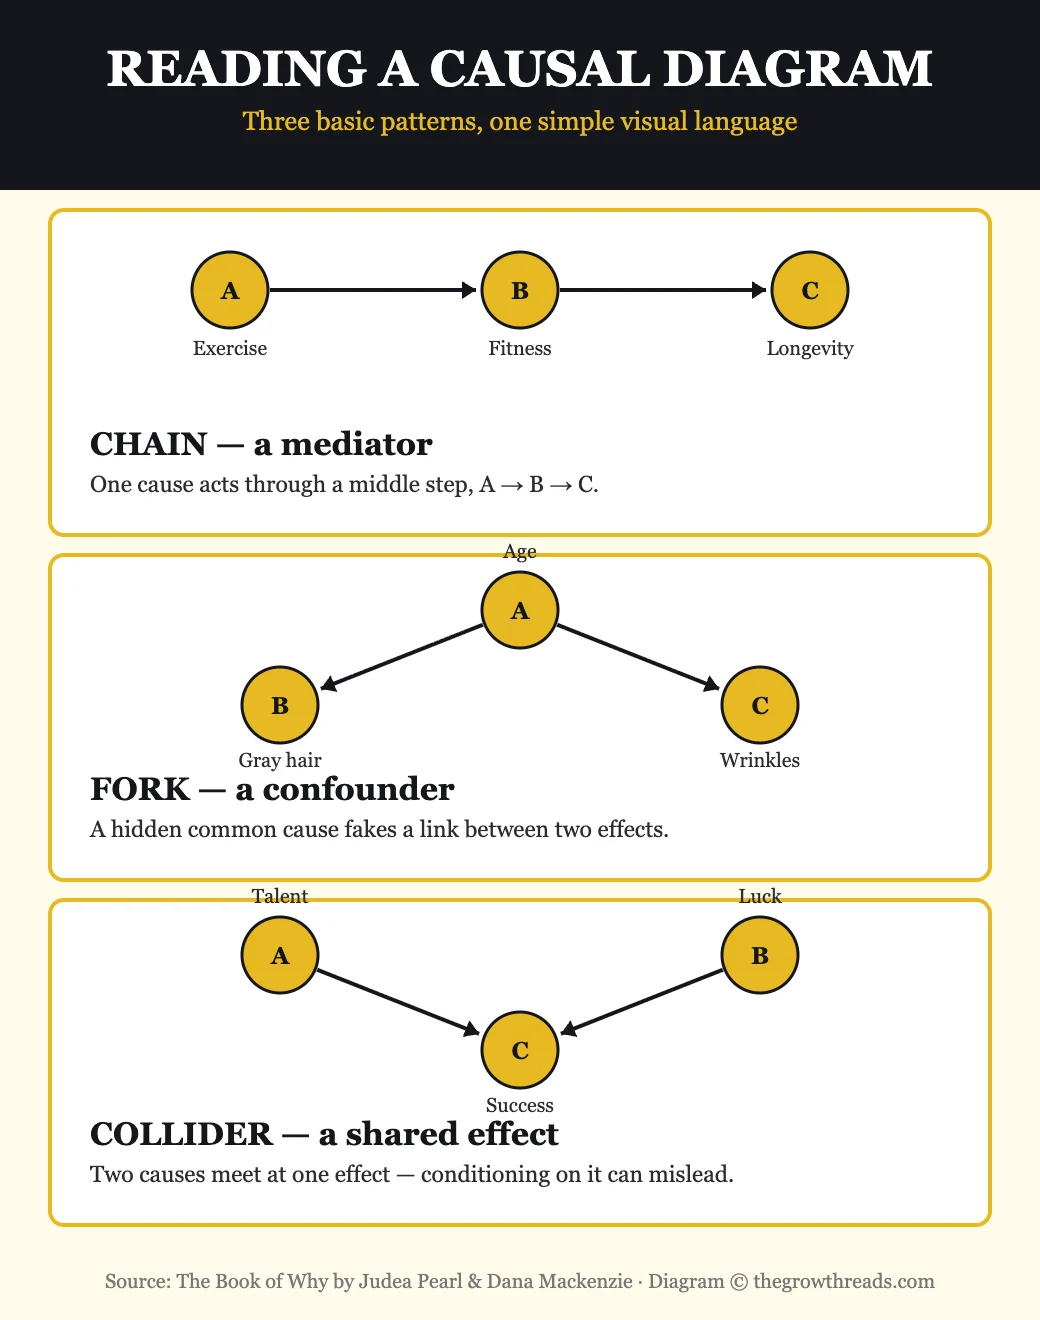
Three small patterns explain almost everything a diagram can tell you. A chain (A causes B causes C) represents a cause acting through a middle step — exercise improves fitness, fitness extends longevity. A fork (A causes both B and C) represents a confounder — age drives both gray hair and wrinkles, so they’ll correlate even though neither causes the other. A collider (A and B both cause C) represents two independent causes converging on one effect — talent and luck both contribute to success, but that doesn’t mean they’re correlated with each other generally.
That third pattern is the most counterintuitive: statisticians are trained to “control for” variables to isolate an effect, but controlling for a collider does the opposite of what’s intended — it can create a fake correlation between variables that were genuinely independent before you conditioned on their shared effect. (Look only at successful people, and talent and luck end up negatively correlated — an artifact of the selection, not because talented people are less lucky.) A diagram tells you in advance exactly which variables are safe to control for.
This isn’t academic: Pearl traces how the mid-20th-century smoking–lung cancer debate got tangled for years by statisticians correctly noting correlation alone couldn’t prove causation, with no formal language yet for confounders versus real causal pathways. A diagram gives both sides a shared, checkable object to argue about.
TGR Note: Gary Marcus and Ernest Davis make a related case in Rebooting AI: today’s deep learning lacks structured world models — exactly what leaves it unable to reason the way a causal diagram does. Marcus argues from AI’s brittleness in practice; Pearl supplies the missing theoretical vocabulary for what “structured knowledge” could formally mean.
Part 4: Do-Calculus, Counterfactuals, and Why AI Needs to Climb Higher
A diagram shows your assumptions; do-calculus, Pearl’s formal rules for computing an answer from that shape, is algebra for causation — given a diagram and observational data, it tells you whether a rung-2 question (“what happens if I do X?”) is answerable without running the experiment. This is how epidemiologists estimate a treatment’s effect from health records, or economists estimate a policy’s impact from historical data, when a real trial would be too slow or unethical.
Do-calculus is honest about its limits: sometimes no rearrangement makes an effect computable from the data you have — it’s “not identifiable,” and no cleverness can manufacture an answer that isn’t there, telling you when you need a real experiment instead.
The top of the ladder, counterfactual reasoning, is where the argument gets personal. A rung-2 answer tells you whether a drug helps patients on average; rung-3 asks whether this specific patient would have survived had she taken it — a question about a branch of history that never happened. Pearl argues this capacity is inseparable from human judgment: every act of regret, every assignment of credit or blame, is a counterfactual claim computed instinctively by people who’ve never heard of a DAG.
Here Pearl turns toward AI directly. However fluent today’s models seem, he argues they remain rung-one machines: powerful pattern completers with no explicit representation of intervention or counterfactual reasoning underneath the fluency. A system that has never represented “what if” can’t reliably explain its own decisions causally, can’t robustly generalize outside its training data, and can’t participate in anything resembling moral reasoning — all three require rungs it was never built to climb. For Pearl, machines with genuine common sense need causal models, not just larger pattern matchers.
TGR Note: Eric Topol’s Deep Medicine shows this ladder in a clinical setting: an AI model can excel at rung-1 pattern recognition — flagging a suspicious scan — while the causal question patients actually care about (“did this treatment cause the recovery?”) still needs rung-2 and rung-3 reasoning no diagnostic accuracy alone can supply.
Who is The Book of Why best for — and who should read something else first?
This book rewards readers comfortable with abstraction who want a rigorous framework, not just a reframe of “correlation isn’t causation.” It’s a strong fit for analysts, ML engineers, dashboard-driven product managers, and policy people defending causal claims. Readers wanting the full math should expect real notation in later chapters.
For a gentler, story-first introduction to how algorithms and data work before tackling Pearl’s framework, start with Hello World or The Master Algorithm, then return to The Book of Why to go deeper on the “why” those systems still struggle with.
Questions to reflect on
- Think of a metric you track at work. Are you certain it causes the outcome you care about — or could it just correlate with it?
- Where have you “controlled for” a variable without checking whether it was actually a collider?
- Recall a policy that worked in a pilot but didn’t scale — could a Simpson’s-Paradox-style subgroup effect explain it?
- If you drew a causal diagram for one decision you’re facing, what would the nodes and arrows be?
- What’s one claim in the news this month stated as causal but really only supported by correlation?
🔥 Ready to think like a causal reasoner?
Get The Book of Why and learn the framework behind modern causal inference — straight from Pearl and Mackenzie.
How to apply The Book of Why (7-day plan)
- Day 1: Pick a metric you track at work and classify it: association, intervention, or counterfactual?
- Day 2: Note three correlations from the news, and name the likely trap behind each.
- Day 3: Sketch a simple causal diagram (3–5 nodes) for one real decision you’re facing.
- Day 4: Check one “control variable” you use — could it secretly be a collider?
- Day 5: Look for a Simpson’s-Paradox-style reversal in a dataset you have.
- Day 6: Find one real experiment or A/B test relevant to your work and note how it embodies intervention.
- Day 7: Write a short counterfactual about a recent decision — what would have happened otherwise, and how confident are you, really?
Frequently asked questions
What is the Ladder of Causation?
Judea Pearl’s framework for three levels of reasoning about cause and effect. Rung 1, Association, is spotting patterns in data — where most statistics and machine learning operate. Rung 2, Intervention, is predicting what happens if you actively change something, the level a real experiment tests. Rung 3, Counterfactuals, is reasoning about what would have happened under different circumstances — the level human judgment and moral responsibility live on. Each rung requires strictly more than the one below it.
Is The Book of Why hard to read for a non-mathematician?
The core ideas — the three rungs, causal diagrams, Simpson’s Paradox — use everyday examples and are accessible to general readers. Some later chapters carry formal do-calculus notation, which is more demanding; treat those as optional deep dives rather than required reading.
What is do-calculus, in plain English?
A set of formal rules for figuring out whether — and how — an intervention’s effect can be computed from observational data plus a causal diagram. It takes “what happens if I do X?” and either shows how to answer it from existing data, or proves the data can’t, meaning you need a real experiment instead.
What is Simpson’s Paradox?
It occurs when a trend in several subgroups reverses once those subgroups are combined into one total. The book’s kidney-stone example: one treatment looks worse overall but wins within every stone-size subgroup, because doctors gave tougher cases to that treatment. Trusting the aggregate or the subgroups depends on the causal structure behind the data, not the numbers alone.
Does the book require any programming or statistics background?
No programming is needed, and only general comfort with correlation and probability is assumed for most of it. Basic statistics helps with the later technical chapters, but the core argument — rungs, diagrams, paradoxes — is built from stories that don’t require prior training.
How is this different from a typical “correlation isn’t causation” article?
Most popular explanations stop at a warning: correlation doesn’t prove causation, be careful. This book goes further, supplying an actual toolkit — diagrams and do-calculus — for determining when a causal claim is rigorously supported and when it isn’t, which is why it’s used as a reference in epidemiology and economics.
Why does Judea Pearl think today’s AI can’t achieve true understanding?
Pearl argues today’s dominant AI, however fluent, is fundamentally a rung-1 pattern-matcher — never given a way to represent “what if I intervene” or “what if things had gone differently.” Without that, he argues, it can’t reliably explain its own decisions, generalize robustly to new situations, or reason morally — all needing rungs 2 and 3, not more rung-1 data.
Related summaries
- The Master Algorithm — Pedro Domingos’s tour of machine learning’s major schools, nearly all operating at the Ladder’s first rung.
- Rebooting AI — Gary Marcus and Ernest Davis on why deep learning needs structured, causal-style knowledge.
- Weapons of Math Destruction — Cathy O’Neil on real harm caused by correlation-only algorithms.
- Deep Medicine — Eric Topol on AI in healthcare, where causal questions matter as much as diagnostic accuracy.
- See the full Best AI & Technology Books list for more picks in this silo.
How we analyze books: we read the full text, cross-check key facts and figures, and distill the core arguments into practical, no-fluff summaries you can act on. We never fabricate quotes or statistics. Read our full methodology.
Related Technology Summaries
Automating Inequality Summary & Review: How Algorithms Punish the Poor
Deep Medicine Summary & Review: How AI Could Give Doctors Back Their Time
Superagency Summary & Review: What Could Possibly Go Right with AI
Superminds Summary & Review: How People and AI Think Smarter Together
Weapons of Math Destruction Summary & Review: How Algorithms Quietly Punish the Poor