

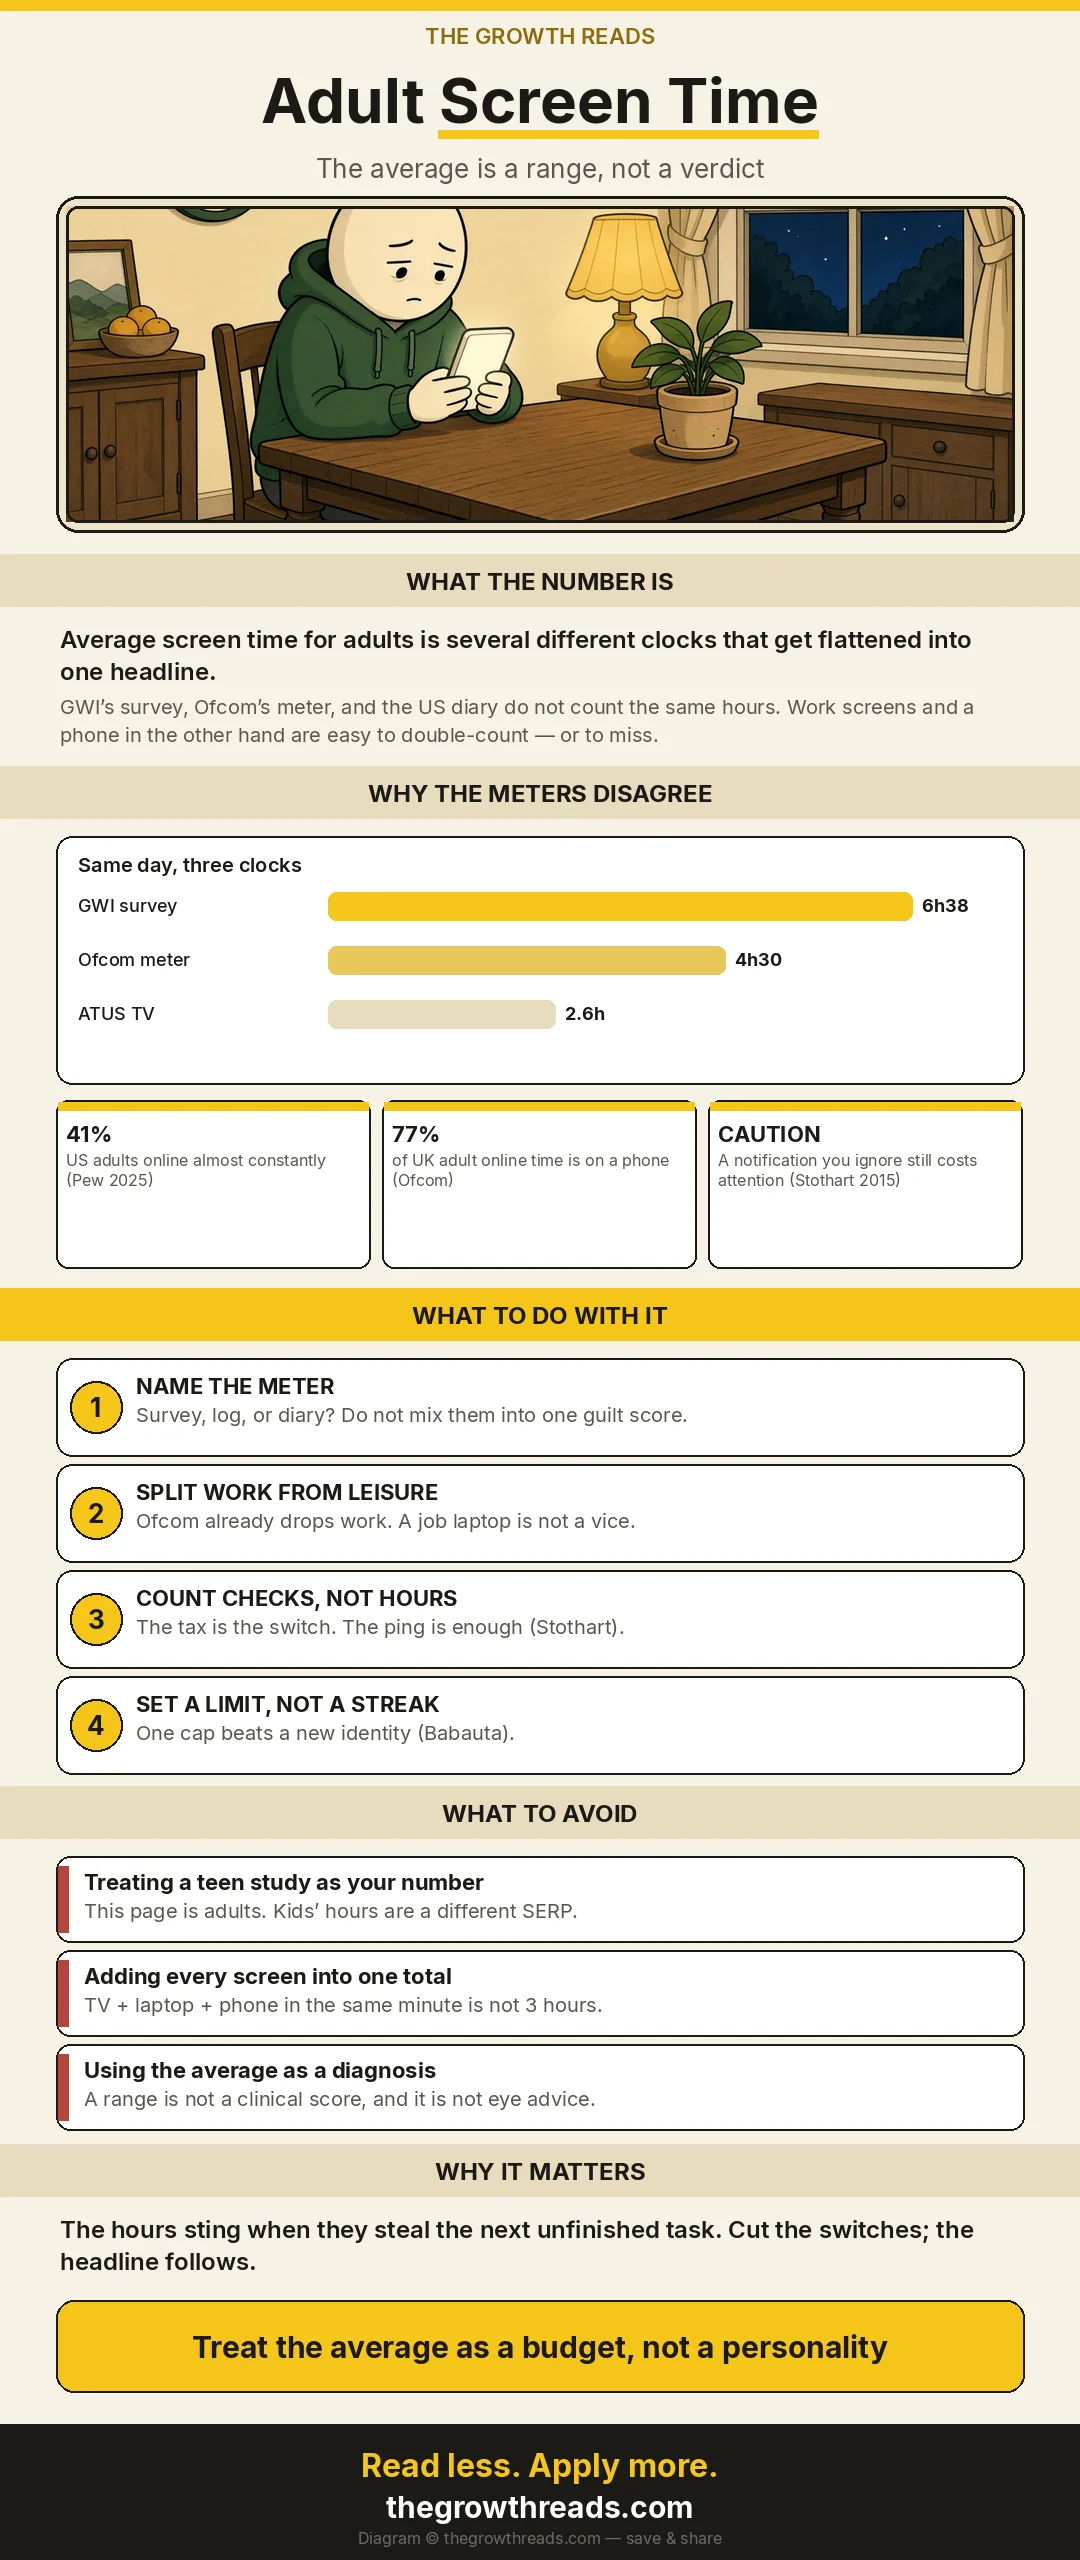
Average screen time for adults is not one number: meters put it near four and a half hours of logged leisure internet, or six and a half hours of self-reported time online. The headline is a range. The cost is that most of a waking workday already competes with the attention one unfinished task needs.
Key takeaways
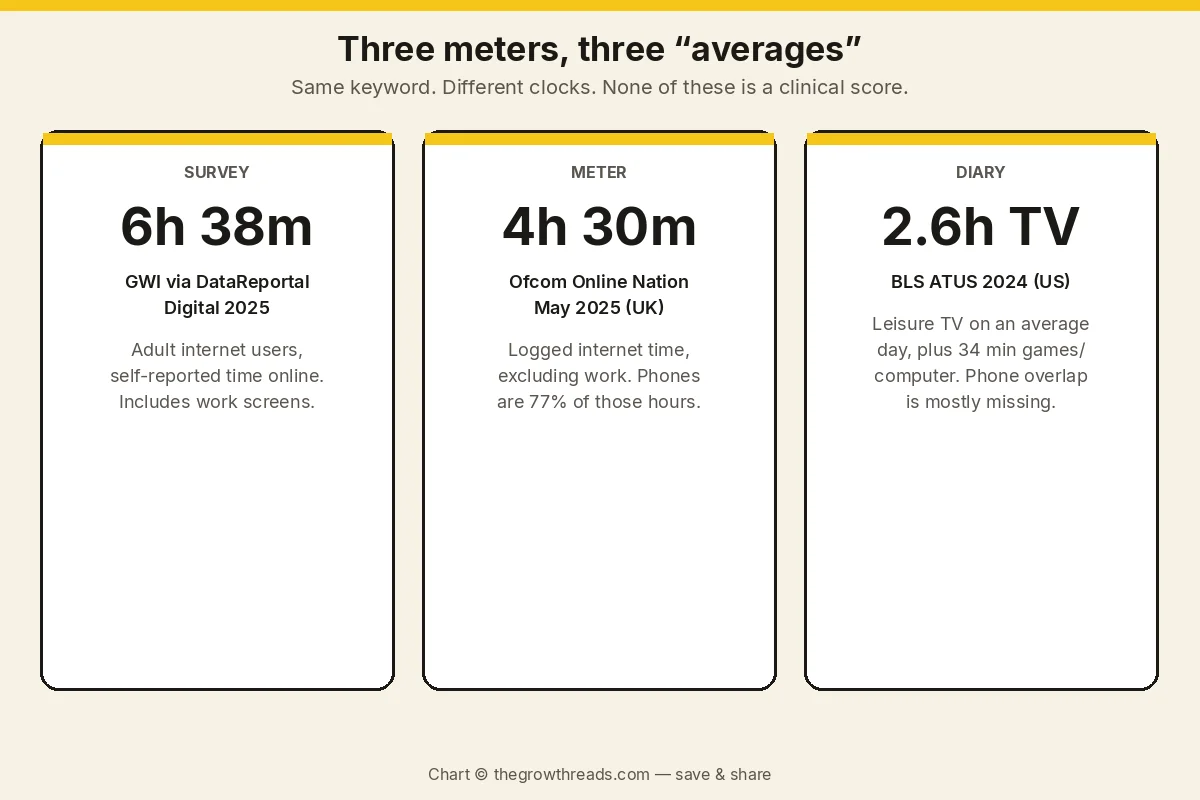
- GWI’s survey, reported in DataReportal’s Digital 2025 overview, finds adult internet users spend an average of 6 hours 38 minutes online each day — self-reported time on the internet, not a lab measurement of every glowing rectangle.
- Ofcom’s Online Nation 2025 report, using Ipsos Iris logs for May 2025, puts UK adults at 4 hours 30 minutes online per day excluding work, up 10 minutes on 2024, with smartphones accounting for 77% of that time.
- Pew Research Center’s 2025 NPORS (5,022 US adults, 5 February–18 June) finds 41% of adults say they are online almost constantly and 90% go online daily — a frequency measure, not an hour count.
- The US American Time Use Survey for 2024 records 2.6 hours of television and 34 minutes of games or computer use for leisure on an average day, a diary that mostly misses overlapping phone use and work screens.
- A notification you do not even check can still disrupt an attention-demanding task at a similar magnitude to using the phone (Stothart, Mitchum & Yehnert, 2015) — the tax is the switch, not the daily total alone.
What average screen time for adults actually is
Average screen time for adults is a family of measurements of how long grown internet users spend with glowing rectangles — not a single official clock, and not a children’s guideline in adult clothing. Search results mash those clocks together. A self-reported “time online” figure, a metered log that drops work, a diary of leisure television, and a question about being online “almost constantly” are four different instruments. They can all be true on the same Tuesday.
The useful definition for this page is adult attention hours: time that competes with one unfinished task. That is why it sits under how to focus better rather than under health, parenting, or eye-strain advice. The sister page how to reduce screen time is the method. This page is the number, the meters behind it, and what the hours actually tax.
Leo Babauta’s The Power of Less is the book this cluster already points at: limits beat identity. An average is only useful if you treat it as a budget you can cap, not as a personality you have to confess.
Screen time, time online, and phone time are not synonyms
“Screen time” is the search phrase; “time online” and “phone time” are the things most reports actually measure. DataReportal’s Digital 2025 overview quotes GWI on adult internet users spending 6 hours 38 minutes online each day, and notes that this is already about 40% of a waking life spent with digital devices and services. That is internet time, including work screens for many respondents, and it is self-report.
Ofcom’s meter is stricter. Online Nation 2025, using Ipsos Iris for May 2025, records 4 hours 30 minutes of UK adult internet use per day excluding work. Eighteen-to-twenty-four-year-olds averaged 6 hours 20 minutes; adults 65 and over averaged 3 hours 20 minutes. Smartphones were 77% of all that logged time. The same regulator’s Adults’ Media Use and Attitudes 2024 report found 28% of social-media users felt they spent too long on social platforms — 48% of 16-to-24s, 8% of those 65 and over. Feeling “too long” and logging four and a half hours are related, not identical.
Pew does not publish an hour count at all. In the 2025 National Public Opinion Reference Survey, 41% of US adults said they use the internet almost constantly, 43% several times a day, 6% about once a day. Ninety percent are online daily. Ninety-one percent own a smartphone. Frequency is what that survey can defend. Hours are not.
Why the averages disagree
The averages disagree because they do not count the same hours, in the same countries, with the same instrument. Collapse them into one viral total and you invent a statistic nobody measured.
GWI’s Digital 2025 figure is a survey of adult internet users. From Q1 2024 the panel includes people over 65, which pulled the global mean down because older users spend less time online. DataReportal is explicit about that composition change. The 6 hours 38 minutes is also two minutes below the prior year’s headline, and the same as late 2019. It is not a rocket. It is a plateau that already occupies most of the remaining day once you sleep.
On devices, the same Digital 2025 overview reports 3 hours 46 minutes of internet use on mobile and 2 hours 52 minutes on computers. Those two numbers add to 6 hours 38 minutes. (The report’s accompanying percentage line swaps mobile and computer; the minutes are the part that adds up.) Mobile is the larger slice of time. It is still not the whole story: broadcast television, offline games, and a second screen in the other hand sit outside that sum.
Digital 2026, the later Kepios / GWI cut, does not restate that 6-hour-38 headline in the public overview. What it does say is more useful for attention: online adults spend more than an hour a day on social networks such as Facebook and X; adding YouTube and TikTok lifts that to well over two and a half hours a day, or 18 hours 36 minutes a week — about 16% of waking hours on feeds. All online media, including streaming TV, is about 33½ hours a week, or roughly 29% of waking life. That is a media diet, not a phone-only score.
The US diary tells a quieter story because it asks people to reconstruct a day. ATUS 2024 (released June 2025) finds watching TV still dominates leisure at 2.6 hours on an average day, with 34 minutes of playing games or using a computer for leisure. Those are not “adults never touch a phone.” They are diary categories that under-count a phone used while cooking, commuting, or sitting in front of the TV. Work computer time lives in the work category, not in leisure. Add the job laptop to the leisure TV block in your head and you have double-counted; leave it out and the “average screen time” looks tiny. Both errors are common. Ofcom already chose a side: drop work.
What each meter includes
| Meter | What it counts | Latest headline | What it misses or mixes |
|---|---|---|---|
| GWI via DataReportal Digital 2025 | Self-reported time online among adult internet users, all devices | 6 hours 38 minutes per day | Self-report error; work screens sit inside the total; offline TV is out; 65+ entered the panel in 2024 |
| Ofcom Online Nation 2025 (Ipsos Iris) | Logged UK adult internet use, May 2025, excluding work | 4 hours 30 minutes per day; phones 77% | Work laptops; some broadcast TV; it is a UK log, not a world census |
| BLS American Time Use Survey 2024 | Diary of leisure: TV, games, computer use; civilian population 15+ | 2.6 hours TV; 34 minutes games/computer leisure | Overlapping phone use; work screens; 15-to-17-year-olds sit in the sample |
| Pew NPORS 2025 | How often US adults go online | 41% almost constantly; 90% daily | No hour total at all |
A C-tier keyword on a hard SERP still has to tell the truth about its own numbers. The honest sentence is not “adults now spend X hours.” It is “depending on the meter, adults spend a workday-shaped amount of time with screens, and the phone is most of the leisure internet.”
Why the hours cost more than they feel like
The hours cost more than they feel like because most of the tax is paid in switches, not in the daily total. A six-hour block of deep editing and a six-hour fog of pings can log the same screen time. Only one of them leaves attention residue on the next task.
Cary Stothart, Ainsley Mitchum and Courtney Yehnert showed in 2015 that simply receiving a cell-phone notification — without looking at the phone or touching it — disrupted performance on a sustained-attention task at a magnitude comparable to actually using the phone for a call or a text. The ping is the event. The hour-count is the sum of events you stopped noticing.
That is the same mechanism as notification overload: the signal, not the content. Kostadin Kushlev, Jason Proulx and Elizabeth Dunn ran a within-subjects week in 2016 (n = 221) in which people either maximised phone interruptions (alerts on, phone in reach) or minimised them (alerts off, phone away). Participants reported more inattention when alerts were on, and that inattention predicted lower self-reported productivity. This page does not treat that questionnaire as a diagnosis. It treats it as a work finding: the default ping setting is a focus setting.
Sophie Leroy’s 2009 experiments on attention residue are the reason a “quick check” is not free even when it is short. Switching away from an unfinished Task A leaves part of working memory attached to A, and Task B suffers. Completing A helps, but only when it comes with enough time pressure to actually disengage. A phone that keeps opening loops is a residue machine. Gloria Mark, Daniela Gudith and Ulrich Klocke found in a 2008 CHI study that interrupted people often finished the original task in less time, with no drop in quality — by working faster, at the cost of higher stress, frustration, time pressure and effort. The calendar still looks green. The person does not.
Eyal Ophir, Clifford Nass and Anthony Wagner’s 2009 PNAS paper compared heavy and light media multitaskers and found heavy switchers were worse at filtering irrelevant information and, surprisingly, worse at a task-switching test. That study is correlational: it cannot prove that years of screen-hopping caused the filter to thin, rather than people with a leaky filter drifting toward more streams. Hold that limit. It still means the brag of multitasking is the wrong read of a high screen-time day.
The counter-case on “just put the phone in another room.” Ward, Duke, Gneezy and Bos (2017) found that the mere presence of one’s smartphone reduced available working memory and fluid intelligence, even when people did not touch it, with the largest cost among those who reported more dependence. A preregistered direct replication by Ruiz Pardo and Minda (2022) did not reproduce the location effect on the operation-span task. Distance is still a cheap experiment. It is not a law of physics. The stronger, better-replicated move is to kill the notification, which Stothart measured without anyone picking the phone up.
Put the meters next to that mechanism and the adult average stops being a morality play. Four and a half logged leisure hours, or six and a half self-reported internet hours, is enough room for hundreds of pings. A short attention span is often a short gap between signals. The number is the budget. The switch is the leak.
Nearby numbers that are not this one
Several neighbouring phrases share a SERP with average screen time for adults and answer a different question. Mixing them is how a productivity page turns into a parenting page or an eye-health page, which this one is not.
| Phrase | What it actually measures | Not this page |
|---|---|---|
| Time online | Internet use (survey or log) | Broadcast TV and offline games may sit outside it |
| Phone screen time | One device, often from iOS/Android screen-time tools | Misses the laptop and the television |
| Almost constantly online | Pew’s frequency item | Not convertible into hours |
| Children’s screen time | Under-18 guidance and paediatric SERPs | A different audience; we do not write that page here |
| How to reduce screen time | The method cluster | Already live as the sister article; this page stays on the number |
If the job is “cut the hours,” go to the sister. If the job is “stop the ping,” go to notification overload. If the job is “hold one target,” stay with how to stay on task and single tasking. The hub for the whole silo is productivity.
What to do with the number
Use the average as a budget you can inspect, not as a verdict on character. Play-slot pages do not ship a numbered how-to schema. The moves below are the ones the evidence actually supports.
Name the meter before you name a goal. If your phone’s screen-time report says 4 hours, that is Ofcom-shaped (one device, often excluding the work laptop). If a headline says 6 hours 38 minutes, that is GWI-shaped (all internet, self-report, work included). Do not subtract one from the other and call the gap “progress.”
Split work from leisure the way Ofcom already does. A designer’s eight hours in Figma is not the same pile as two hours of feed. Babauta’s limit-setting in The Power of Less is useful here: cap the leisure pile, not the job that pays for the lights. The adult version of “too much screen time” is almost always the leisure pile leaking into the next unfinished task.
Count checks, not only hours. Stothart’s result says a notification you ignore still costs the current task. Kushlev’s week says alerts-on raises inattention relative to alerts-off. The cheapest experiment is a working block with alerts off and the phone out of grabbing range. Ward’s 2017 distance effect may not replicate as a cognitive-test finding; the notification effect does not need it.
Write a stopping rule for the first check of a block, the way a good limit works in Babauta: one cap, visible, boring. “After I send the draft, I may open the phone.” That is an implementation, not a new identity as a low-screen person. Identities lapse. Caps can be renewed tonight.
Common mistakes
- Adding every rectangle into one total. TV plus laptop plus phone in the same minute is not three hours. Ofcom and ATUS both refuse that addition; you should too.
- Treating a teen or child statistic as your number. This page is adults. Children’s hours are a different SERP and a different duty of care.
- Using the global 6 hours 38 minutes as a UK or US fact. Ofcom’s UK log is 4 hours 30 minutes excluding work. Pew’s US number is a frequency, not an hour count.
- Reading a high average as proof you cannot focus. Six hours of editing and six hours of pings share a clock and not a cost. The leak is the switch.
- Silencing the phone but leaving banners on. Stothart’s cost is the notification arriving, not the decision to reply. Face-down with badges still lighting is not “off.”
- Copying a reduction challenge without a meter. The sister how to reduce screen time page is the method. Start there once you know which clock you are reading.
- Turning the average into eye advice or a diagnosis. Neither belongs on this URL. If sleep, mood, or attention concerns are clinical, that is a different professional, not a productivity article.
When the hours are the job
When most of the hours are the job, the average is not a vice to shrink — it is a map of where the switches hide. Ofcom already excludes work from its 4 hours 30 minutes. Your laptop does not get that courtesy unless you give it one. A knowledge-work day can log eight hours of “screen time” and still be a focused day if the pings are batched and the loops are closed (Leroy). The failure mode is not “I use a computer.” It is “the computer keeps opening a second task before the first has a written next step.”
If the role is support, news, or community, some interruption is the work. Then the cap belongs on the leisure pile after hours, not on the queue you are paid to watch. Babauta’s less is a limit on commitments, not a pretend offline job. And if the hours feel unmovable because the role is the screen, the still-available lever is the one Stothart isolated: fewer signals that are not the current ticket.
The evidence behind this
| Study or report | Design and size | Finding we used | What we used it for |
|---|---|---|---|
| Kemp / DataReportal Digital 2025 (GWI) | Global survey of adult internet users; 65+ in panel from Q1 2024 | 6 hours 38 minutes online per day; ~40% of waking life with digital devices; 3h46m mobile / 2h52m computer | The survey-shaped “average” |
| Kemp / DataReportal Digital 2026 (GWI) | Later GWI wave plus Similarweb app data (public overview) | Social + video well over 2.5 hours/day (18h36m/week); ~33.5 hours/week all online media including streaming TV | What those internet hours are spent on |
| Ofcom Online Nation 2025 | Ipsos Iris logs, UK adults, May 2025 | 4h30m/day excluding work (+10 min vs 2024); 18–24: 6h20m; 65+: 3h20m; smartphones 77% | The meter-shaped leisure average |
| Pew NPORS 2025 | 5,022 US adults, 5 Feb–18 Jun 2025, address-based multimode | 41% almost constantly online; 90% daily; 91% smartphone | Frequency, not hours |
| BLS American Time Use Survey 2024 | US time-use diary, civilian 15+, annual averages | 2.6 hours TV; 34 minutes games/computer leisure | The diary-shaped leisure screens, and their blind spots |
| Stothart, Mitchum & Yehnert 2015 | Lab SART; notifications without handling the phone | Notification alone disrupted attention comparably to using the phone | Why the leak is the ping |
| Kushlev, Proulx & Dunn 2016 | Within-subjects week, n = 221, alerts on vs off | More inattention with alerts on; inattention predicted lower self-reported productivity | Alerts as a focus setting, not a diagnosis |
| Leroy 2009 | Two experiments on unfinished-task switches | Attention residue from Task A impairs Task B | Why a “quick check” is not free |
| Mark, Gudith & Klocke 2008 | CHI experiment on interrupted knowledge work | Interrupted people finished faster at higher stress and effort | The hidden bill when the calendar still looks fine |
| Ophir, Nass & Wagner 2009 | Lab comparison of heavy vs light media multitaskers | Heavy multitaskers filtered worse and switched worse; correlational | The counter-brag on a high-switch day |
| Ward et al. 2017; Ruiz Pardo & Minda 2022 | Phone-location working-memory tests; 2022 is a preregistered replication | 2017 found a “brain drain” of mere presence; 2022 did not replicate the OSpan location effect | Named counter-case: distance is optional, notifications are not |
| Ofcom Adults’ Media Use and Attitudes 2024 | UK adult media-literacy survey | 28% of social-media users felt they spent too long; 48% of 16–24 vs 8% of 65+ | Feeling vs logging |
Frequently asked questions
What is the average screen time for adults?
There is not one average. GWI’s survey, reported in DataReportal’s Digital 2025 overview, puts adult internet users at 6 hours 38 minutes online per day. Ofcom’s metered Online Nation 2025 report puts UK adults at 4 hours 30 minutes online per day in May 2025, excluding work. The US time-use diary (ATUS 2024) records 2.6 hours of television plus 34 minutes of games and computer use for leisure. Treat the keyword as a range across meters, not a single guilt score you failed to hit.
Does average screen time include work?
It depends on the meter. GWI’s 6 hours 38 minutes is time spent online among adult internet users, which includes work screens for many people. Ofcom’s 4 hours 30 minutes is logged UK adult internet use with work dropped on purpose. The American Time Use Survey files job computer time under work, not under leisure television. If you add a full-time laptop day to a leisure-internet figure, you have invented a third number that none of the reports published. Split the piles before you set a cap.
Why is the US figure different from the global one?
Because they are not the same instrument. Pew’s 2025 US survey does not publish hours at all; it finds 41% of adults online almost constantly and 90% online daily. The US diary (ATUS 2024) is leisure TV and computer games, which under-counts phones used alongside other tasks. The global 6 hours 38 minutes is GWI self-report of internet time. Country logs also differ: Ofcom’s UK leisure-internet day is 4 hours 30 minutes. Comparing them as if they were one census is how the SERP gets louder than the footnotes.
Is phone time the same as screen time?
No. Ofcom found smartphones were 77% of UK adults’ logged online time in May 2025, which is most of that meter, not all screens. DataReportal’s Digital 2025 split is 3 hours 46 minutes of internet on mobile and 2 hours 52 minutes on computers. A phone’s built-in screen-time report will miss the laptop and much of the television. Phone time is the right lever if the leak is the ping in your pocket. It is the wrong total if you are trying to describe a whole adult day.
Does a high average mean I am unproductive?
No. The same clock can hold a deep editing day or a hundred unfinished checks. Stothart, Mitchum and Yehnert (2015) found that a notification you do not answer still disrupts an attention task. Leroy (2009) found that switching off an unfinished task leaves residue on the next one. Mark, Gudith and Klocke (2008) found interrupted people often finish faster by paying in stress and effort. Productivity lives in the switches. The daily total is only the budget those switches spend.
How should I measure my own screen time?
Pick one meter and keep it still for two weeks. A phone OS report is a device log. A weekend time-use diary in ATUS categories (work, TV, games, everything else) will show overlap the phone misses. Do not average those two into a personal “true” number. If the goal is focus, a more honest metric is checks per work block, or whether alerts were on, which is the contrast Kushlev, Proulx and Dunn (2016) actually ran. Hours without a meter definition are a mood.
Is this article about children’s screen time?
No. Average screen time for adults is an adult attention page: what the hours are, which meter produced them, and how they compete with unfinished work. We do not give paediatric screen-time guidance, school-run advice, or eye-health rules on this URL. Those are different duties of care and different SERPs. If you arrived with a child-hours query, this is the wrong article. The adult method page on this site is how to reduce screen time; the parent cluster is how to focus better.
How is this different from how to reduce screen time?
This page owns the number and the meters. How to reduce screen time owns the method — the checking loop, the cuts, the mistakes that undo a cut. We keep them separate so one URL is not forced to rank for both a statistics query and a how-to query. Read this first if you need to know whether 4 hours 30 minutes and 6 hours 38 minutes can both be true. Then use the sister page to set a cap, and The Power of Less if you want the book-length case for limits rather than a new identity.
Sources
- Simon Kemp / Kepios, Digital 2025: Global Overview Report, DataReportal, 2025. GWI daily time online (6 hours 38 minutes), device split, 65+ panel note, ~40% of waking life. datareportal.com/reports/digital-2025-global-overview-report
- Simon Kemp / Kepios, Digital 2026: Global Overview Report, DataReportal, 2025. Social and video time (18 hours 36 minutes/week); ~33.5 hours/week all online media. datareportal.com/reports/digital-2026-global-overview-report
- Ofcom, Online Nation 2025, Ipsos Iris, May 2025. UK adults 4 hours 30 minutes/day excluding work; age splits; smartphone share 77%. PDF
- Ofcom, Adults’ Media Use and Attitudes 2024. 28% of social-media users felt they spent too long; 48% of 16–24 vs 8% of 65+. PDF
- Pew Research Center, NPORS technology use, 5 February–18 June 2025, n = 5,022. 41% of US adults online almost constantly; 90% daily; 91% smartphone. Mobile fact sheet; almost-constantly chart
- US Bureau of Labor Statistics, American Time Use Survey — 2024 Results, 26 June 2025. 2.6 hours watching TV; 34 minutes games and computer use for leisure. news release
- Cary Stothart, Ainsley Mitchum and Courtney Yehnert, “The attentional cost of receiving a cell phone notification,” Journal of Experimental Psychology: Human Perception and Performance 41(4), 2015, 893–897. doi:10.1037/xhp0000100
- Kostadin Kushlev, Jason Proulx and Elizabeth W. Dunn, “Silence Your Phones: Smartphone Notifications Increase Inattention and Hyperactivity Symptoms,” CHI 2016, 1011–1020. doi:10.1145/2858036.2858359
- Sophie Leroy, “Why is it so hard to do my work? The challenge of attention residue when switching between work tasks,” Organizational Behavior and Human Decision Processes 109(2), 2009, 168–181. doi:10.1016/j.obhdp.2009.04.002
- Gloria Mark, Daniela Gudith and Ulrich Klocke, “The cost of interrupted work: more speed and stress,” CHI 2008, 107–110. doi:10.1145/1357054.1357072
- Eyal Ophir, Clifford Nass and Anthony D. Wagner, “Cognitive control in media multitaskers,” PNAS 106(37), 2009, 15583–15587. doi:10.1073/pnas.0903620106
- Adrian F. Ward, Kristen Duke, Ayelet Gneezy and Maarten W. Bos, “Brain Drain: The Mere Presence of One’s Own Smartphone Reduces Available Cognitive Capacity,” Journal of the Association for Consumer Research 2(2), 2017, 140–154. doi:10.1086/691462 — counter-case: Ana C. Ruiz Pardo and John Paul Minda, “Reexamining the ‘brain drain’ effect,” Acta Psychologica 230, 2022, 103717. doi:10.1016/j.actpsy.2022.103717
Related reading on The Growth Reads
Books. The Power of Less — limits and essential load, the down-link this row was assigned because the average is only useful as a cap.
Articles. How to reduce screen time is the method sister. How to focus better is the Focus parent. Notification overload, attention residue, multitasking, short attention span, single tasking and how to stay on task are the nearby Focus mechanisms.
Hub. All of this sits on the productivity pillar.
How this article was researched
Primary figures were taken from the public DataReportal Digital 2025 and Digital 2026 overviews (GWI / Kepios), Ofcom’s Online Nation 2025 PDF, Ofcom’s Adults’ Media Use and Attitudes 2024 PDF, Pew’s 2025 NPORS mobile fact sheet and almost-constantly chart, and the BLS ATUS 2024 news release. Attention costs were taken from the peer-reviewed papers listed above, each checked for title, year, venue and DOI before use. Aggregator pages that restated a “6 hours 51 minutes of global adult screen time” figure were not used; that number does not appear in the Digital 2026 overview we fetched.
Limits: GWI is self-report; Ofcom is a UK log; ATUS is a US diary that includes 15-to-17-year-olds in some tables and under-counts overlapping phone use; Pew is frequency, not hours; Ophir et al. is correlational; Ward et al. 2017 did not replicate on the operation-span location effect in Ruiz Pardo and Minda 2022. Kushlev et al. used inattention items that other writers treat as clinical language — we report the productivity finding only. This is not children’s screen-time guidance and not eye-health advice.
Method: open reports and papers, quoted with dates and instruments, then applied to adult attention at work. No original survey. Last reviewed 15 September 2026.