

Procrastination statistics are not one rate — they are answers to different questions about who was asked and how delay was defined. Steel’s 2007 review collected the famous 80–95% college figure as earlier estimates, not a new census. The adult chronic range sits nearer 15–20%. Read the sample before you quote the headline.
Key takeaways
- Steel (2007) treated 80–95% of college students as a range of prior estimates (Ellis and Knaus, 1977; O’Brien, 2002), not as a fresh population census.
- Harriott and Ferrari (1996) found about 20% of 211 community adults claimed to be chronic procrastinators — a different question from “have you ever delayed a paper.”
- Ferrari, Díaz-Morales, O’Callaghan, Díaz and Argumedo (2007) measured 1,347 adults in six countries and found 13.5% “pure” arousal and 14.6% “pure” avoidant procrastinators after controlling for the other scale.
- Tice and Baumeister (1997) showed the short-term stress benefit of delay reversed by the end of term, with lower grades and more illness overall — so a mid-semester “I’m fine” is not a cost statistic.
- Kim and Seo (2015) pooled 33 studies and 38,529 participants and found academic procrastination negatively correlated with academic performance, with the relationship depending on how both sides were measured.
What procrastination statistics actually measure
A procrastination statistic is a count of a defined delay in a defined room — not a personality score for the human species. The search phrase sounds like one national rate waiting to be announced. The productivity read is narrower. Every usable figure answers three questions at once: who sat in the sample, what “delay” meant on the form, and whether the paper was measuring how common the behaviour is or what it later cost. Mix those and you get a number that travels further than its method.
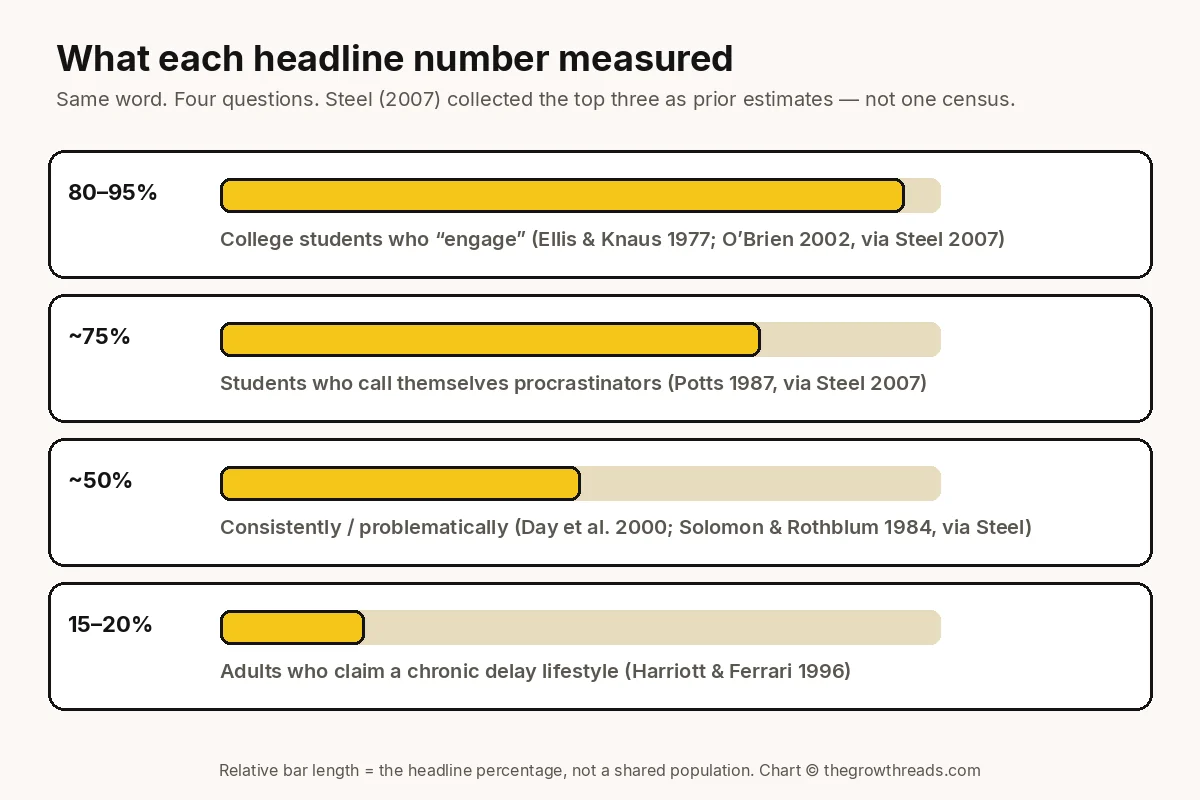
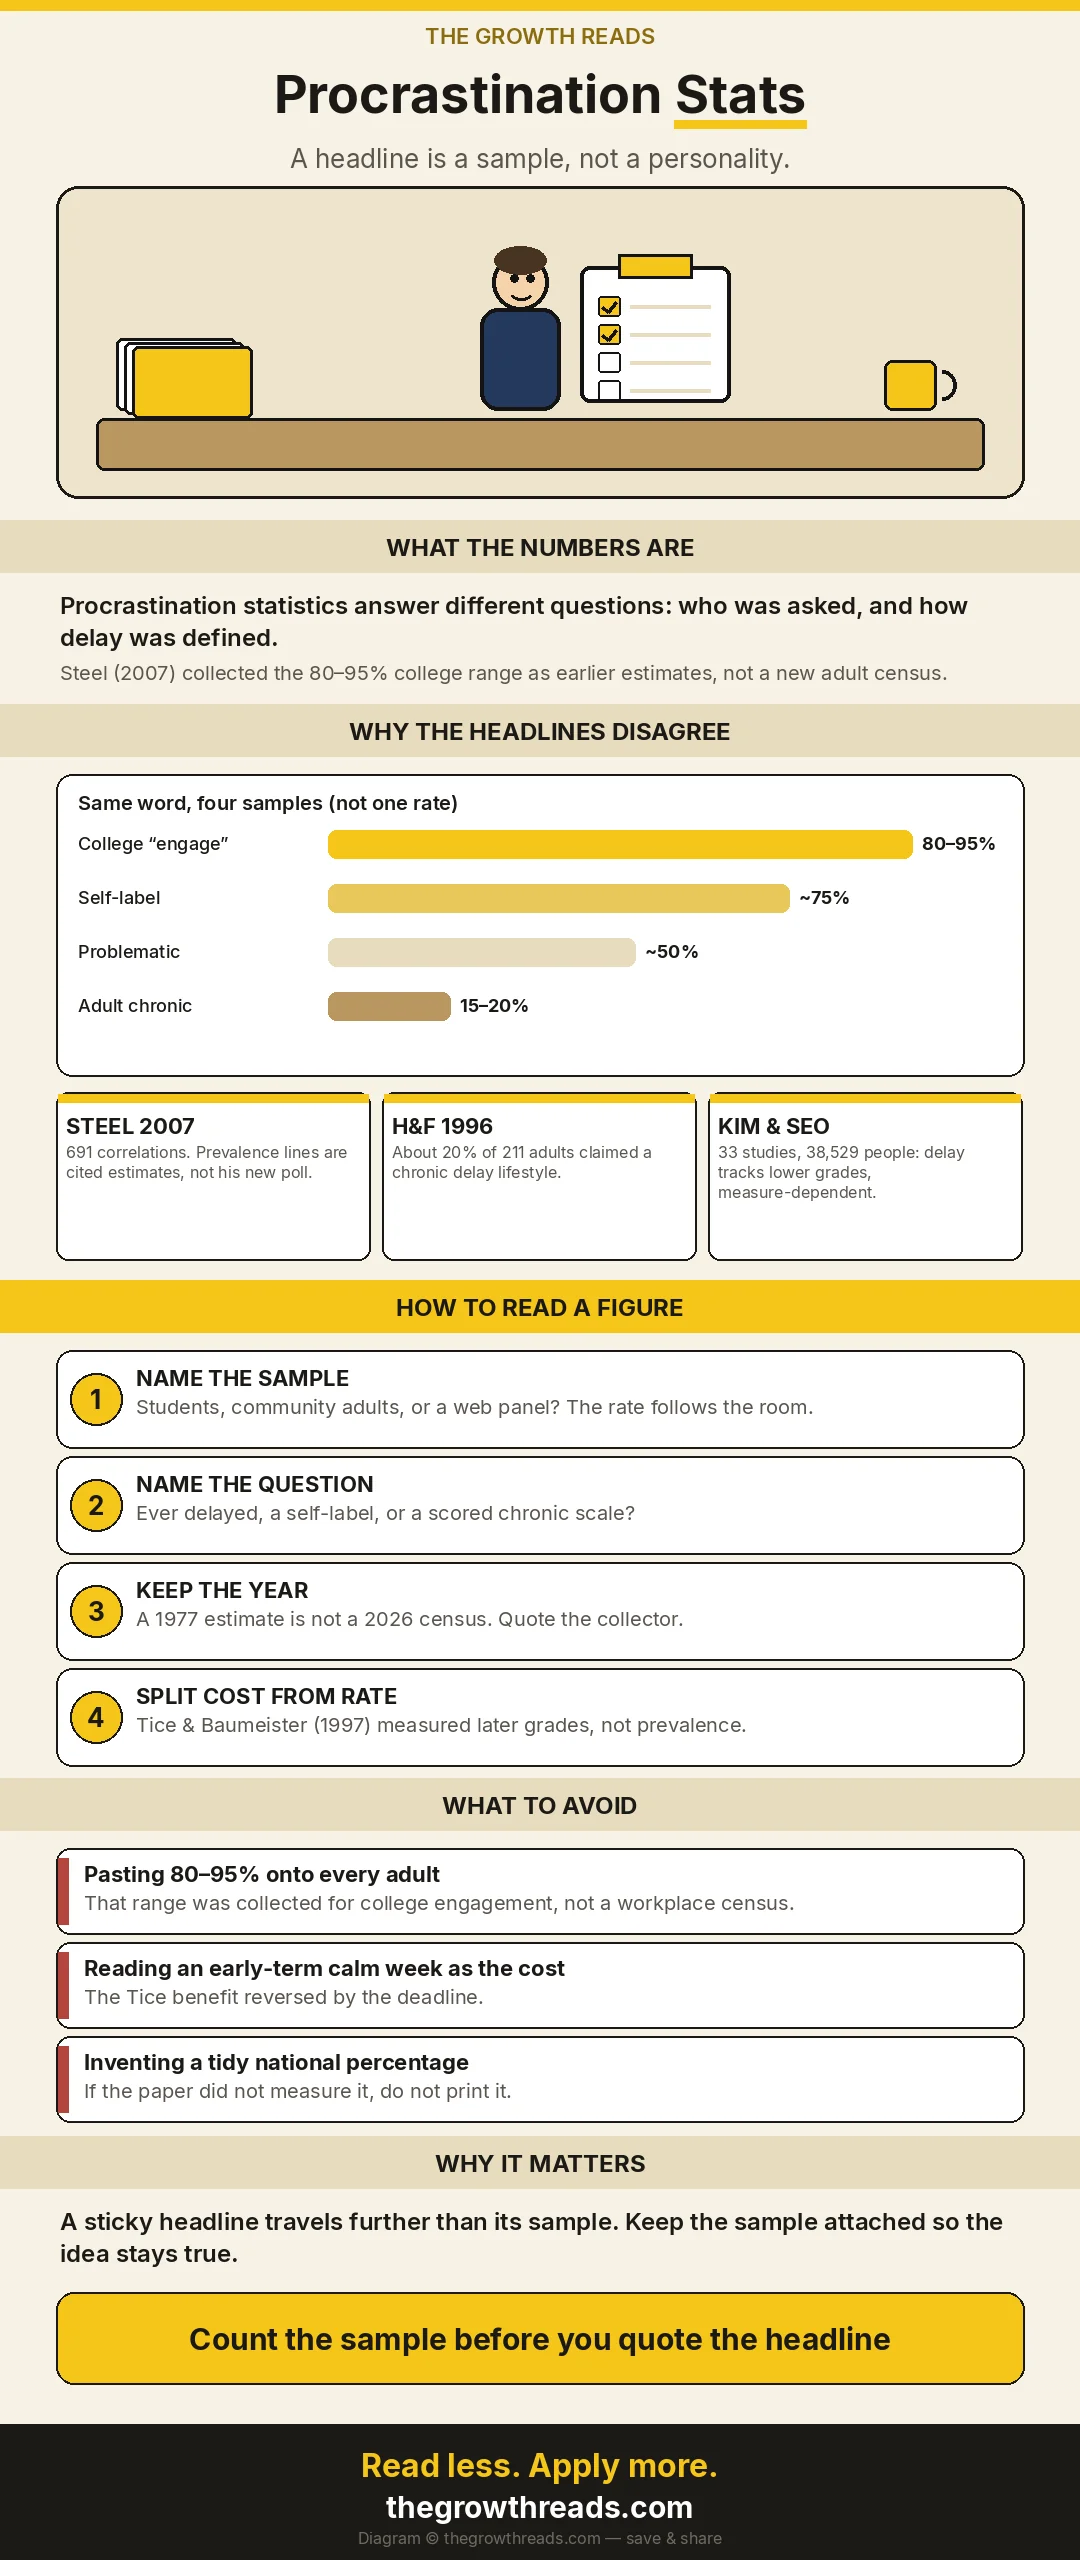
Piers Steel’s 2007 meta-analysis in Psychological Bulletin is the paper most headline writers are quietly quoting, even when they do not name it. He synthesised 691 correlations on causes and effects. The prevalence lines that open that paper are not a new poll he ran. They are a stack of earlier estimates: 80–95% of college students “engage” in procrastination (Ellis and Knaus, 1977; O’Brien, 2002); about 75% consider themselves procrastinators (Potts, 1987); almost 50% do so consistently and problematically (Day, Mensink and O’Sullivan, 2000; Solomon and Rothblum, 1984, among others). Steel then adds the adult line: chronic delay affecting some 15–20% of adults (Harriott and Ferrari, 1996). Those are four different questions. This URL exists to keep them from collapsing into one slogan.
The parent page how to overcome procrastination already owns the method for getting a delayed task moving. This page does not restage that method and does not emit a HowTo ladder. It owns the numbers people type when they want a figure to wave at a meeting. The sister page chronic procrastination owns the lifestyle version of the 15–20% range — frequent delay as a pattern, not a one-off paper. Use that page when the question is “is this my default,” and this page when the question is “what did the study actually count.”
Chip and Dan Heath’s Made to Stick is the unused review this row was given, and it earns the slot for a specific reason. Their first trait of a sticky idea is simplicity: a compact sentence that a stranger can repeat. “80–95% of people procrastinate” is simple. It is also underspecified. The Heaths’ job is to make an idea travel. This page’s job is to keep the sample attached so the idea stays true. That is not a lab finding, and we will not dress a popular-science book as one. It is the library’s closest book-length name for “a headline that outruns its method.”
Prevalence estimates vs cost findings
Prevalence asks how common a defined delay is; a cost finding asks what later moved with that delay. Steel’s opening percentages are prevalence estimates, most of them from student rooms, most of them self-report. Tice and Baumeister (1997) and Kim and Seo (2015) are cost papers: grades, stress, illness, academic performance. Nguyen, Steel and Ferrari (2013) sit in a third room — an internet sample of 22,053 people, with employment and income as the correlates. You can quote all three families on one slide. You cannot add them into one “the science says X% and it costs Y” sentence without inventing a study that does not exist.
Why the headline numbers disagree
The headlines disagree because they counted different rooms, asked different questions, and then reused the same English word. “Procrastination” on a campus delay scale is not “procrastination” on Ferrari’s chronic adult measures, and neither is “I put the report off last Tuesday.” If you need one sentence for a standup, use that. The rest of this section is the working.
Student figures run high because the room is built for deadline work and the questions are often generous. “Engage in procrastination” can catch a single delayed essay. A self-label (“I am a procrastinator”) is an identity item, not a frequency count. “Consistently and problematically” is closer to a problem, which is why Steel’s stack drops from the 80s toward 50. None of those three is a census of working adults. Treating Ellis and Knaus (1977) — a book-length estimate Steel cites — as if it were a 2026 labour-force survey is how a meeting gets a number that cannot be audited.
Adult figures run lower because the question gets stricter. Harriott and Ferrari (1996) asked 211 adults at four public meetings (122 women, 89 men, mean age 47.6) about decisional, avoidant, and arousal procrastination. About 20% — 42 people — claimed to be chronic procrastinators. That is a self-claim in a convenience sample, not a household probability survey. Ferrari and colleagues (2007) then took two chronic scales to 1,347 adults in Spain, Peru, Venezuela, the United Kingdom, Australia, and the United States. The two scales correlated at r = .72, so they reported “pure” scores after controlling for the other: 13.5% arousal, 14.6% avoidant, with no significant sex or nationality differences. Those two percentages are not independent slices you should add into “28% of the planet.” They are two ways of scoring a highly overlapping tendency.
The four questions every figure has to survive
- Who sat in the room? Undergraduates, community adults at public meetings, or an internet panel. Nguyen, Steel and Ferrari (2013) are explicit that 22,053 web respondents are not a labour-force frame.
- What did the item ask? Ever delayed, self-label, scored chronic scale, or a behavioural timestamp (when the paper was handed in). Those are not aliases.
- Is this prevalence or cost? A rate of “how many” cannot be rewritten as “and therefore they earn less” without the paper that measured earnings.
- What year is attached? Steel collected 1977–2003 estimates into a 2007 review. A 1996 adult claim is still the adult claim we have. It is not a 2026 update, and this page will not invent one.
The productivity library already holds the parent method and the sister pages. This article does not replace them. It names the sample so those pages have a number that can survive a hostile read.
Why the costs show up later than the delay
Delay feels cheap at the moment of putting the work down, which is why a cost statistic that is taken too early will lie in your favour. Dianne Tice and Roy Baumeister’s 1997 longitudinal studies in Psychological Science are the cleanest demonstration we will use. Students who scored higher on procrastination reported lower stress and less illness early in the term. By the end of term the pattern reversed: more stress, more illness, and they were sicker overall. They also received lower grades on the term paper and the exams. The short-term benefit is real enough to seduce a diary. The bill is later. A Thursday in week three where “I work better under pressure” feels true is not a finding. It is the first half of their curve.
Kim and Seo (2015) asked the academic-cost question at meta-analytic scale: 33 studies, 38,529 participants. Procrastination was negatively correlated with academic performance. The useful caution is in the same abstract: the size of that relationship moved with the measures. Self-report scales made the link harder to see; externally assessed delay and externally recorded grades showed it more clearly. “Active procrastination,” in their reading, may not be procrastination at all. This page will not turn that into a pep-talk about good delay. It will also not invent a single r for the whole literature. The direction is the claim we can defend: more measured academic delay, worse measured academic performance, with the instrument doing real work.
Nguyen, Steel and Ferrari (2013) moved the cost question into work. In 22,053 internet respondents, higher procrastination was associated with lower salaries, shorter employment duration, and a greater likelihood of being unemployed or underemployed rather than working full-time. That is an observational web sample. It is not a randomised career. It does not prove that putting off one email caused a smaller paycheck. It does show that, in that large self-selected group, the delay score and the work outcomes travelled together. Quote the association. Do not promote it to a salary formula.
Fuschia Sirois (2007) tested the procrastination–health model in 254 community-dwelling adults. Trait procrastination was associated with higher stress, more acute health problems, and fewer wellness behaviours, plus fewer household safety behaviours and less frequent dental and medical check-ups. In her structural model, stress fully mediated the procrastination–health link; health behaviours did not once stress was in the picture. That is a cross-sectional self-report paper, not a clinic, and not a symptom list. The productivity use is modest: the cost of delay is not only a late file. It is also the later load of the things you parked — including the check-up you meant to book. We will not write a health page on the back of that sentence.
Two honest caveats. Steel’s 80–95% line is a cited range of earlier estimates, including a 1977 book, not a probability sample of today’s students. Nguyen’s income and employment links are observational in a web sample — treat the direction as the claim, not a causal pay cut. Tice and Baumeister studied course deadlines, not a career. Sirois is cross-sectional. Observational and convenience samples get named as such. They still beat an unsourced “studies show 80% of professionals.”
The cost that does not need a dramatic percentage is the identity cost. Once “everyone procrastinates” is read as permission, people stop distinguishing a delayed email from a chronic pattern. The procrastination cycle page owns the loop. This page owns the reason the loop gets a statistic attached to it: a sticky number is easier to repeat than a sample note.
Nearby numbers that are not this page
Several neighbouring pages share a delay word with this one and answer a different question. Keep them linked, not merged. This URL is the statistics page: what was counted, in whom, in which year. It is not a how-to ladder, not a rewrite of the live morning-routine how-to, and not a clinical scale.
| Idea | What it actually is | What it is not |
|---|---|---|
| Procrastination statistics | A map of dated prevalence and cost figures, with the sample still attached | One national rate, or a personality test |
| How to overcome procrastination | The Procrastination parent: the method for starting the delayed task | A second statistics table |
| Chronic procrastination | Frequent delay as a lifestyle pattern — the 15–20% adult question as an experience | A new census of that range |
| Procrastination examples | What delay looks like in ordinary work, not how common it is | A percentage |
| What causes perfectionism | A delay driver in the same parent cluster | A prevalence paper for “everyone” |
| The benefits of procrastination | The short-term ease Tice recorded in week three | A rebuttal of the end-of-term cost |
| What procrastination actually means | The definition, not the count | A substitute for a dated sample |
| How to build a morning routine | A fixed cue-to-action sequence. Already live. Do not rewrite it here | A checklist page, and not a statistics page |
The live morning-routine how-to and the live morning-routine checklist are different phrases and different jobs. This article does not restage either of them. A statistic can describe how often a morning start slips; it cannot become a new dawn stack.
Common mistakes
- Pasting 80–95% onto every adult in the building. Steel collected that range for college engagement, from earlier writers. It is not a workplace census.
- Adding Ferrari’s 13.5% and 14.6% as if they were two separate populations. The scales overlapped (r = .72). “Pure” scores are residuals, not two rooms of people.
- Treating an early-term calm week as the cost study. Tice and Baumeister’s benefit reversed by the deadline. Early ease is the first half of the curve.
- Turning Nguyen’s pay and job correlates into a salary formula. Observational web sample. Direction, not a causal $X per point.
- Restaging the parent as a HowTo ladder here. Play slots do not emit that ladder. How to overcome procrastination already owns the method.
- Rewriting the morning-routine how-to or the live checklist. Different phrases, already published. A statistics page is not a new dawn stack.
- Inventing a tidy national percentage because the slide had a hole. If the paper did not measure it, this page will not print it. That is the whole job.
The evidence behind this
The claim on this page is modest: the famous percentages are dated answers to different questions, and the cost papers measure later outcomes, not a second copy of the same rate. The table is the working, not a highlight reel.
| Study | Design and size | Finding | What we used it for |
|---|---|---|---|
| Steel (2007), Psychological Bulletin | Meta-analysis, 691 correlations; prevalence lines are cited prior estimates | Strong predictors: task aversiveness, delay, self-efficacy, impulsiveness, conscientiousness. Weak: neuroticism, rebelliousness, sensation seeking. Opening rates: 80–95% / ~75% / ~50% students; 15–20% adults | Why “the” rate is a stack, and which correlates survive aggregation |
| Harriott & Ferrari (1996), Psychological Reports | 211 adults at four public meetings; mean age 47.6 | About 20% (42 adults) claimed to be chronic procrastinators | The adult chronic self-claim, with the convenience sample named |
| Ferrari et al. (2007), JCCP | 1,347 adults, six nations; two chronic scales, r = .72 | 13.5% “pure” arousal, 14.6% “pure” avoidant; no sex or nationality differences | Why adult figures sit well below the student headlines, and why the two % cannot be added |
| Tice & Baumeister (1997), Psychological Science | Two longitudinal student studies across a term | Lower stress and illness early; higher later; sicker overall; lower paper and exam grades | Cost arrives after the delay. Early ease is not the bill |
| Kim & Seo (2015), PAID | Meta-analysis, 33 studies, 38,529 participants | Negative correlation with academic performance; stronger when delay and grades were externally assessed | Academic cost at scale, without inventing a single r |
| Nguyen, Steel & Ferrari (2013), IJSA | Internet sample, N = 22,053 | Higher procrastination associated with lower salary, shorter tenure, more unemployment / underemployment | Work correlates. Observational, not causal |
| Sirois (2007), PAID | 254 community adults; self-report + SEM | Higher stress, more acute health problems, fewer wellness and safety behaviours; stress fully mediated the health link | Later-load cost outside the gradebook. Cross-sectional; not a clinic |
| Solomon & Rothblum (1984), Journal of Counseling Psychology | Academic Procrastination Scale development; student sample | A foundational academic delay measure; cited by Steel among the “consistently / problematically” estimates | Where the ~50% problem-range sits in the stack — via Steel, not as a new poll |
Frequently asked questions
What do procrastination statistics actually measure?
They measure a defined delay in a defined sample. A campus item about “engaging” in procrastination, a self-label (“I am a procrastinator”), a scored chronic scale, and a later grade or stress score are four different measurements. Steel (2007) collected the famous student percentages as earlier estimates and then ran a 691-correlation meta-analysis on causes and effects. This page keeps those jobs separate. If a slide does not say who was asked and what the item asked, it is not a statistic yet. It is a slogan wearing a percent sign.
Is it true that 80–95% of people procrastinate?
It is true that Steel (2007) reported estimates that 80–95% of college students engage in procrastination, citing Ellis and Knaus (1977) and O’Brien (2002). It is not true that this is a measured rate for all adults, all workers, or the year you are reading this. “Engage” is a wide net. The same opening stack drops to about 75% who self-label and about 50% who delay consistently and problematically. Quote the student engagement range with its room and its year. Do not paste it onto a company all-hands as a census of the species.
What percent of adults are chronic procrastinators?
The figure this page will defend is “about 15–20%,” and only as a self-claim in the samples we have. Harriott and Ferrari (1996) found about 20% of 211 community adults claimed to be chronic procrastinators. Steel (2007) used that range for the general population line. Ferrari and colleagues (2007) later reported 13.5% and 14.6% “pure” arousal and avoidant scores in 1,347 adults across six countries, after controlling for the other highly correlated scale. Those are not a 2026 household survey. They are still better than inventing a national percentage to fill a hole in a slide.
Do procrastination statistics prove that delay is getting worse?
No. Steel (2007) noted that some student percentages appeared to be on the rise, citing Kachgal, Hansen and Nutter (2001), but that is a remark about a cited trend in student reports, not a proof that every workplace in 2026 is worse than 1996. This page will not invent a growth-rate. A newer convenience sample that uses a different scale is not a time series. If you need “is it worse,” you need repeated measures on the same instrument in a comparable room. We do not have that as a single clean number, so we will not print one.
Do procrastinators get worse grades?
In the papers this page trusts, measured academic delay travels with worse measured academic performance. Tice and Baumeister (1997) found lower term-paper and exam grades among students who scored higher on procrastination. Kim and Seo (2015) pooled 33 studies and 38,529 participants and found a negative correlation, stronger when delay and performance were assessed externally rather than by self-report. That is not a destiny and not a moral. It is also not a licence to call every late-night student a chronic case. The instrument matters. The direction is the defensible claim.
Is there a workplace cost in the numbers?
There is an association, not a price tag. Nguyen, Steel and Ferrari (2013) assessed 22,053 internet respondents and found higher procrastination associated with lower salaries, shorter employment, and a greater chance of being unemployed or underemployed rather than full-time. That is a large observational web sample. It does not randomise people into delay. It does not turn one postponed email into a dollar figure. Use it to retire the claim that delay is free at work. Do not use it to forecast someone’s pay. The parent page is where the starting method lives.
Why do different studies disagree?
They asked different people different questions and then used the same word. Student “engagement” items catch almost everyone who has ever delayed a paper. Chronic adult scales catch a smaller group who treat delay as a lifestyle. Cost papers measure later grades, stress, or jobs, not a second copy of the prevalence rate. Ferrari’s 2007 arousal and avoidant scores overlapped (r = .72), so even two percentages from one paper are not two separate populations. Disagreement is usually a methods clash, not a scandal. Attach the sample and the item, and most of the clash becomes readable.
How should I use these numbers at work?
Use them as a brake on slogans, not as a personality test for your team. If someone says “80% of us procrastinate,” ask which sample and which item. If the question is how to start the delayed task, leave this page and use the parent, how to overcome procrastination. If the question is whether delay has become the default week, the sister chronic procrastination page is the experience read of the 15–20% range. A statistic that cannot name its room is not ready for a slide. That is the only workplace use this URL will claim.
Sources
- Steel, P. (2007). The nature of procrastination: A meta-analytic and theoretical review of quintessential self-regulatory failure. Psychological Bulletin, 133(1), 65–94. https://doi.org/10.1037/0033-2909.133.1.65
- Harriott, J., & Ferrari, J. R. (1996). Prevalence of procrastination among samples of adults. Psychological Reports, 78(2), 611–616. https://doi.org/10.2466/pr0.1996.78.2.611
- Ferrari, J. R., Díaz-Morales, J. F., O’Callaghan, J., Díaz, K., & Argumedo, D. (2007). Frequent behavioral delay tendencies by adults: International prevalence rates of chronic procrastination. Journal of Cross-Cultural Psychology, 38(4), 458–464. https://doi.org/10.1177/0022022107302314
- Tice, D. M., & Baumeister, R. F. (1997). Longitudinal study of procrastination, performance, stress, and health: The costs and benefits of dawdling. Psychological Science, 8(6), 454–458. https://doi.org/10.1111/j.1467-9280.1997.tb00460.x
- Kim, K. R., & Seo, E. H. (2015). The relationship between procrastination and academic performance: A meta-analysis. Personality and Individual Differences, 82, 26–33. https://doi.org/10.1016/j.paid.2015.02.038
- Nguyen, B., Steel, P., & Ferrari, J. R. (2013). Procrastination’s impact in the workplace and the workplace’s impact on procrastination. International Journal of Selection and Assessment, 21(4), 388–399. https://doi.org/10.1111/ijsa.12048
- Sirois, F. M. (2007). “I’ll look after my health, later”: A replication and extension of the procrastination–health model with community-dwelling adults. Personality and Individual Differences, 43(1), 15–26. https://doi.org/10.1016/j.paid.2006.11.003
- Solomon, L. J., & Rothblum, E. D. (1984). Academic procrastination: Frequency and cognitive-behavioral correlates. Journal of Counseling Psychology, 31(4), 503–509. https://doi.org/10.1037/0022-0167.31.4.503
Related reading on The Growth Reads
Books. Chip Heath and Dan Heath, Made to Stick — why a simple headline outruns its sample. Pair it with the papers; do not replace them.
Related articles. How to overcome procrastination (parent, the method). Chronic procrastination (sister, the 15–20% as a pattern). Procrastination examples. Procrastination cycle. What causes perfectionism. What procrastination actually means.
Hub. The productivity library is the silo home. Every URL on this page stays inside it.
How this article was researched
We read the Steel 2007 meta-analysis as the collector of the famous student percentages, then checked each headline number against the paper that actually measured it: Harriott and Ferrari 1996, Ferrari et al. 2007, Tice and Baumeister 1997, Kim and Seo 2015, Nguyen, Steel and Ferrari 2013, Sirois 2007, and Solomon and Rothblum 1984. Where Steel cites an earlier estimate (Ellis and Knaus 1977; O’Brien 2002; Potts 1987), we name it as a cited estimate, not as a study we re-ran. We did not invent a national percentage to fill a gap. We did not treat observational work as causal. We did not write a clinical page.
Limits. Several prevalence lines are convenience samples or second-hand citations inside a 2007 review. There is no clean 2026 probability survey on this page. Health findings are self-report and, in Sirois, cross-sectional. Workplace figures are a web sample. If a later representative study replaces the 15–20% adult range, this page should be updated rather than defended.
Method: one play-slot article on the locked v3 template (no HowTo). Four body links: parent, sister, unused review, hub. Numbers without a dated source were left out.